As technology changes, so too does a recommendation.
For years when you deployed XenApp servers with Provisioning Services, the storage Read:Write ratio would be 10:90. This is still the case in most scenarios. But in analyzing the latest data from the Citrix Solutions Lab, who were testing the “RAM Cache with Overflow to Disk” option, we encountered some results that will make us revisit some of our old recommendations.
- IOPS: For a medium workload on XenApp 7.5 on Hyper-V 2012R2, the average IOPS per user is 1, as explained in the previous blog.
- R:W Ratio: When using the new write cache option on Hyper-V 2012R2, the read:write ratio changes to 40:60. (Note: These numbers are taken at the physical host layer and not the VM layer)
Why is this? Why the change?
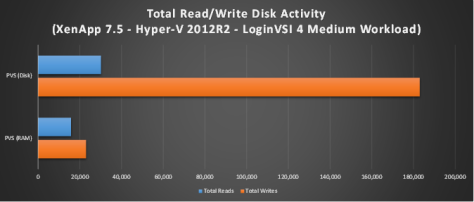
Think about what the RAM Cache with Disk Overflow does… It uses a section of allocated VM RAM to cache disk activity. As this cache fills up, it will start to move portions to disk. If you allocated enough RAM, you significantly reduce the number of IOPS (especially write IOPS). Look at the differences between PVS Disk and RAM Cache options

We’ve significantly reduced write activity because writes go to RAM. And whatever writes do make it to disk from the RAM Cache are bigger block sizes, thus also helping to reduce IOPS.
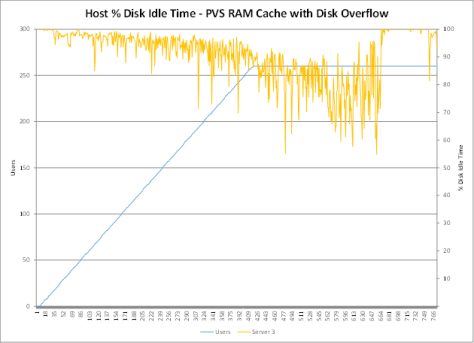
And finally, if you look at the disk idle time on the physical host, you can clearly see that the disks have a higher idle percentage when using the new RAM Cache with Disk Overflow option within PVS because we have less data going to the disk.


So far, the RAM Cache with Disk Overflow option is looking very promising. Soon, I’ll show you what it can do for Windows 7 workloads
For this setup, we used
- LoginVSI 4.0 with a medium workload
- Hyper-V 2012R2
- XenApp 7.5 running on Windows Server 2012R2
- 6 vCPU, 16GB RAM, 2 GB RAM Cache
- 7 VMs per physical host
From the virtual mind of Virtual Feller
Follow @djfeller